
Mirror Mirror On The Wall....
Who's The Hottest of Them All?
Well, it has to be beauty, of course! Even if it wasn’t how do you tell beauty that it’s not. Luckily, we don’t have to lie.
Among the major U.S. CPG departments NIQ tracks, Health & Beauty posted the strongest increase in annual household dollar spend at +8%, ahead of Baby Care (+7%), Food (+4%), Pet Care (+4%), and Household Care (+3%).
Health & Beauty shopping occasions per buyer also rose 4.9%, so this isn’t purely a pricing story, consumers are shopping the category more frequently.
According to Circana, both US mass and prestige beauty sales grew 7% year-over-year during the first half of 2026, from its last year 2025 total of $108.5 billion (Circana’s $108.7B is a retail-market measurement: $72.7B mass beauty + $36.0B prestige beauty), and with positive unit demand on both sides of the business, mass V/S prestige, an important distinction showing that growth isn’t being driven by price increases alone. Consumers may be increasingly selective about where they spend, but they’re still making room in the budget for beauty, particularly across skincare, fragrance, hair care, self-care and wellness-driven products.
NIQ paints an equally interesting picture of the American beauty consumer. Its latest U.S. data values Beauty & Personal Care included at $150.3 billion for the 52 weeks ending April 18, 2026, up 18% versus two years ago. And younger consumers are punching above their weight: Gen Z and Millennials are over-indexing toward premium Beauty & Personal Care, reinforcing a market increasingly divided between consumers seeking value and those willing to spend more when performance, wellness, identity and perceived value justify the price.
Nearly 70% of Circana-tracked U.S. beauty dollars are currently being spent in the mass side of the market, including the increasingly important masstige tier versus roughly 30% in prestige.
Sadly, not everyone can afford Prestige, but it still gets those Pretty Points™
According to Circana, U.S. prestige beauty reached $17.1 billion during the first half of 2026, up 7% year-over-year. Skincare led prestige growth at +9%, prestige hair climbed 11%, and fragrance increased 6%, Meanwhile, makeup posted a more modest 3% gain…. Wah-wah.
If I was a prestige or luxury brand, I’d say “C’mon man WTF (what the frock?) …. the rich over here want to get richer so somebody…., no need to call out the criminals here, better find a way to put more money back into Americans’ disposable spending pockets”. Prestige color cosmetics sales are being turned over to low price dupes, deceptiCONS, and mass.
The customer doesn’t care though as long as they can Instagram by day and then show off their hot bots, by night.
It’s pretty obvious that consumers have upgraded their fragrances, skincare, haircare, and complexion throughout prestige and luxury while getting savvy throughout mass and masstige for their color cosmetics, which I have to say are highly competitive in both formulation and now even packaging. This comes at a timely fashion, (TikToK goes the clock), ready to combat the rise of housing, taxes, electricity, gas, groceries, and everything else.
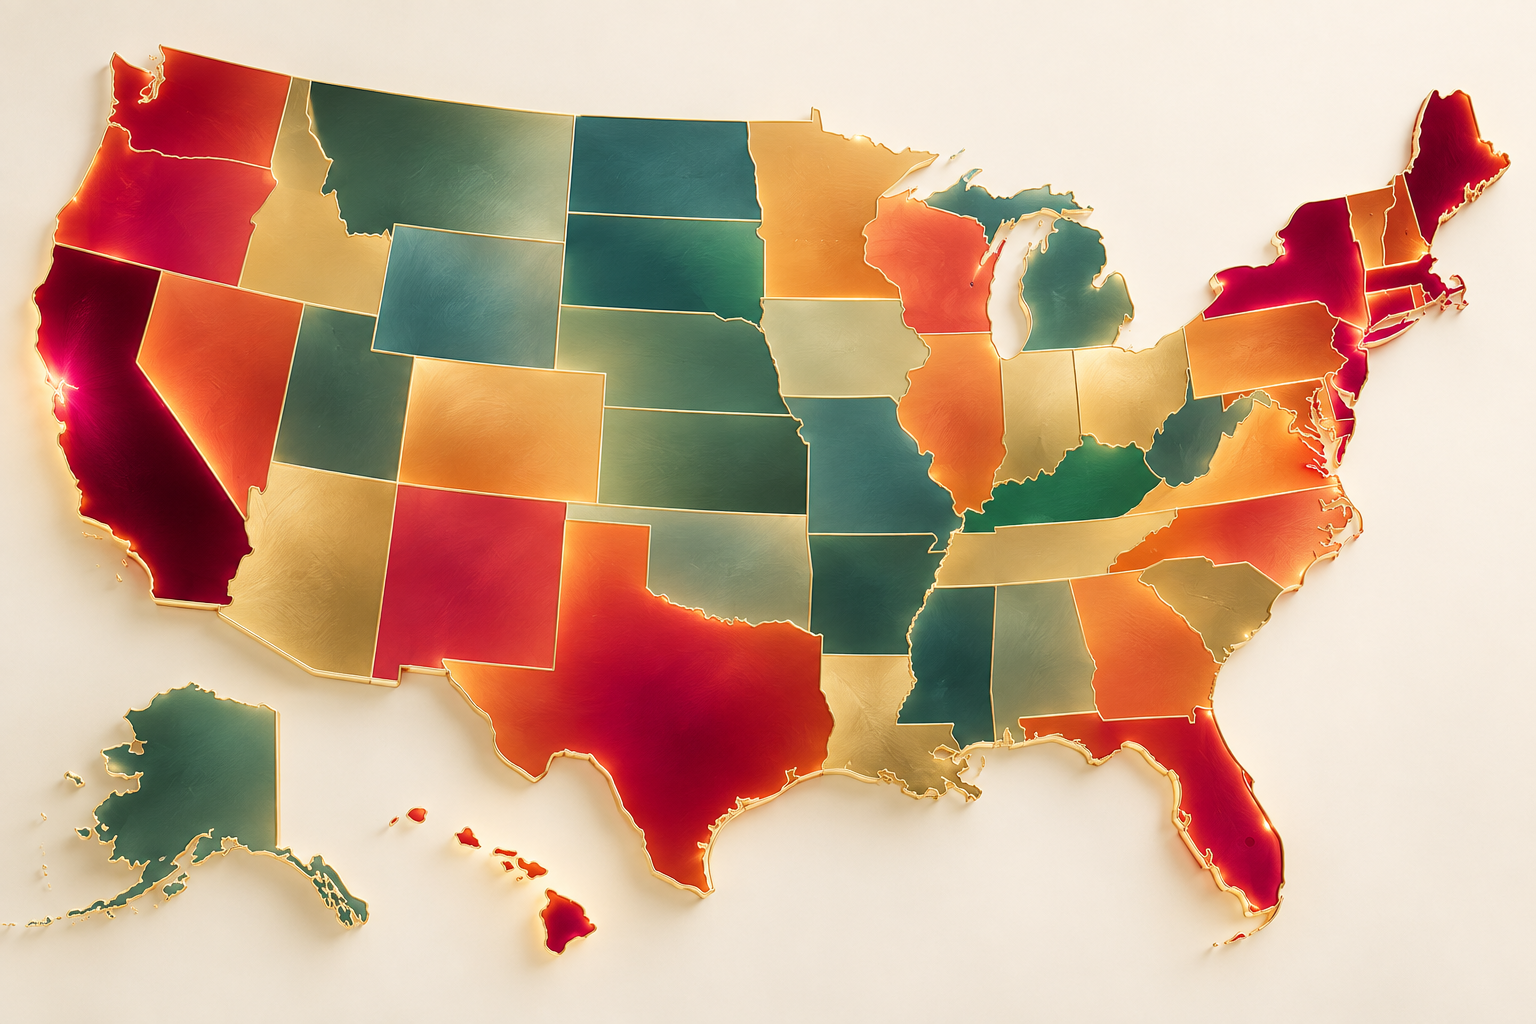
Billions, and billions, and billions – where in the USA is all this money being spent, and what is the mix of age demographics who are spending all this money on…. mirror mirror?
The Writing Is On The Walls

These Are The Hottest Metro Beautiful Markets!
Whether you’re a CMO allocating your marketing budget, or a Head of Field Sales positioning your team and budgets, it’s important to put your dancers on the right stages, whether the digital stage, or the main stage of the sales floor.
Not every market will deliver the same results year after year. Some players keep performing the same song and dance on the same stage, using yesterday’s routine, and delivering a so-so performance. That’s when you hire a consultant or flip your staff.
Sometimes you need to rediscover hot spots, find some new fans, and get your performance confidence back. Let’s take a look at some data that’s available for everyone.
Source: U.S. Bureau of Labor Statistics, Consumer Expenditure Survey, 2023–2024 Metropolitan Averages.
Many start-ups, and small businesses may not have the budget for high-end data so we’re using the latest, and FREE, federal metro spending benchmark on annual household/consumer-unit expenditures, and on Personal Care Products & Services.
No major data company has publicly posted any 2025-2026 metro specific results. It’s how they stay in business – you have to either pay them for that data, or you have to hire us. Trends can change quickly, but most markets have settled into position since the market quick change.
Top 20 Metro Markets Ranked By Average Spend, Per-Person-Per-Year, On Personal Care
Top 20 Metro Markets Showing TTL Population Size, And Generation demographics
BIGGER ISN’T ALWAYS BETTER
For those whose brands target a specific age demographic or want to increase reach of others, I thought the second chart would be most helpful to understand the up-to-date census data on generational penetration. The data is pretty boring but paints a nice picture of how consistent metro-markets are with reported demographic splits.
Sheer population size will always drive volume potential, but sometimes quality over quantity can be found – less spend potential for a bigger return. For high-touch beauty brands, the biggest metro may be your serve and protect, while acquisition and growth may be elsewhere.
The BLS data gives us another way to look at opportunity: how much the average consumer unit in a market is already accustomed to spending on personal care. A smaller market with a higher annual personal-care budget may warrant more luxury brand advertising dollars or a greater investment in artistry, education, events, sampling and other high-touch services—not because there are more customers to reach, but because the customers you do reach may have greater spending potential.
Take Denver versus Los Angeles. Los Angeles has more than four times Denver’s population, yet the latest BLS metro data shows Denver consumer units averaging $1,463 annually on personal care versus $1,155 in Los Angeles—roughly 27% higher. That doesn’t mean Denver is a larger beauty market, nor does it guarantee a Denver shopper will have a larger basket. It does suggest that personal care commands a greater share of the average consumer unit’s spending there, making it an interesting market to test whether additional field investment can generate stronger productivity, or if more targeted advertising and digital/social acquisition dollars can yield a stronger return on ad spend…. granted you target your content to properly sharp grab, sell, and close that customer.
And sometimes the opportunity is even simpler: the customer is already spending the money, so can you get her to spend more of it with you?
What Are You Waiting For?
Get in the
BOXXXOXOXO!
A Big Box Beauty exclusive article written by Dominick Briguglio, CCO of Big Box Beauty
published on 9/10/2026
Check out our other articles
I hear it all the time! I hear it from brand founders, fellow consultants, and brand executives: read all about the culprits.
If cementing relationships with the next generation of consumers isn’t enough to get you excited about Texas, maybe the state’s overall retail growth will.
Mexico is always camera ready for a drama queen performance, and we thank them for still wearing full glam for breakfast!
© 2026 all rights reserved Big Box Beauty LLC, a California company